
 By Mat StuckeyFounder of Holloway · Published 30 September 2026
Every county ranked
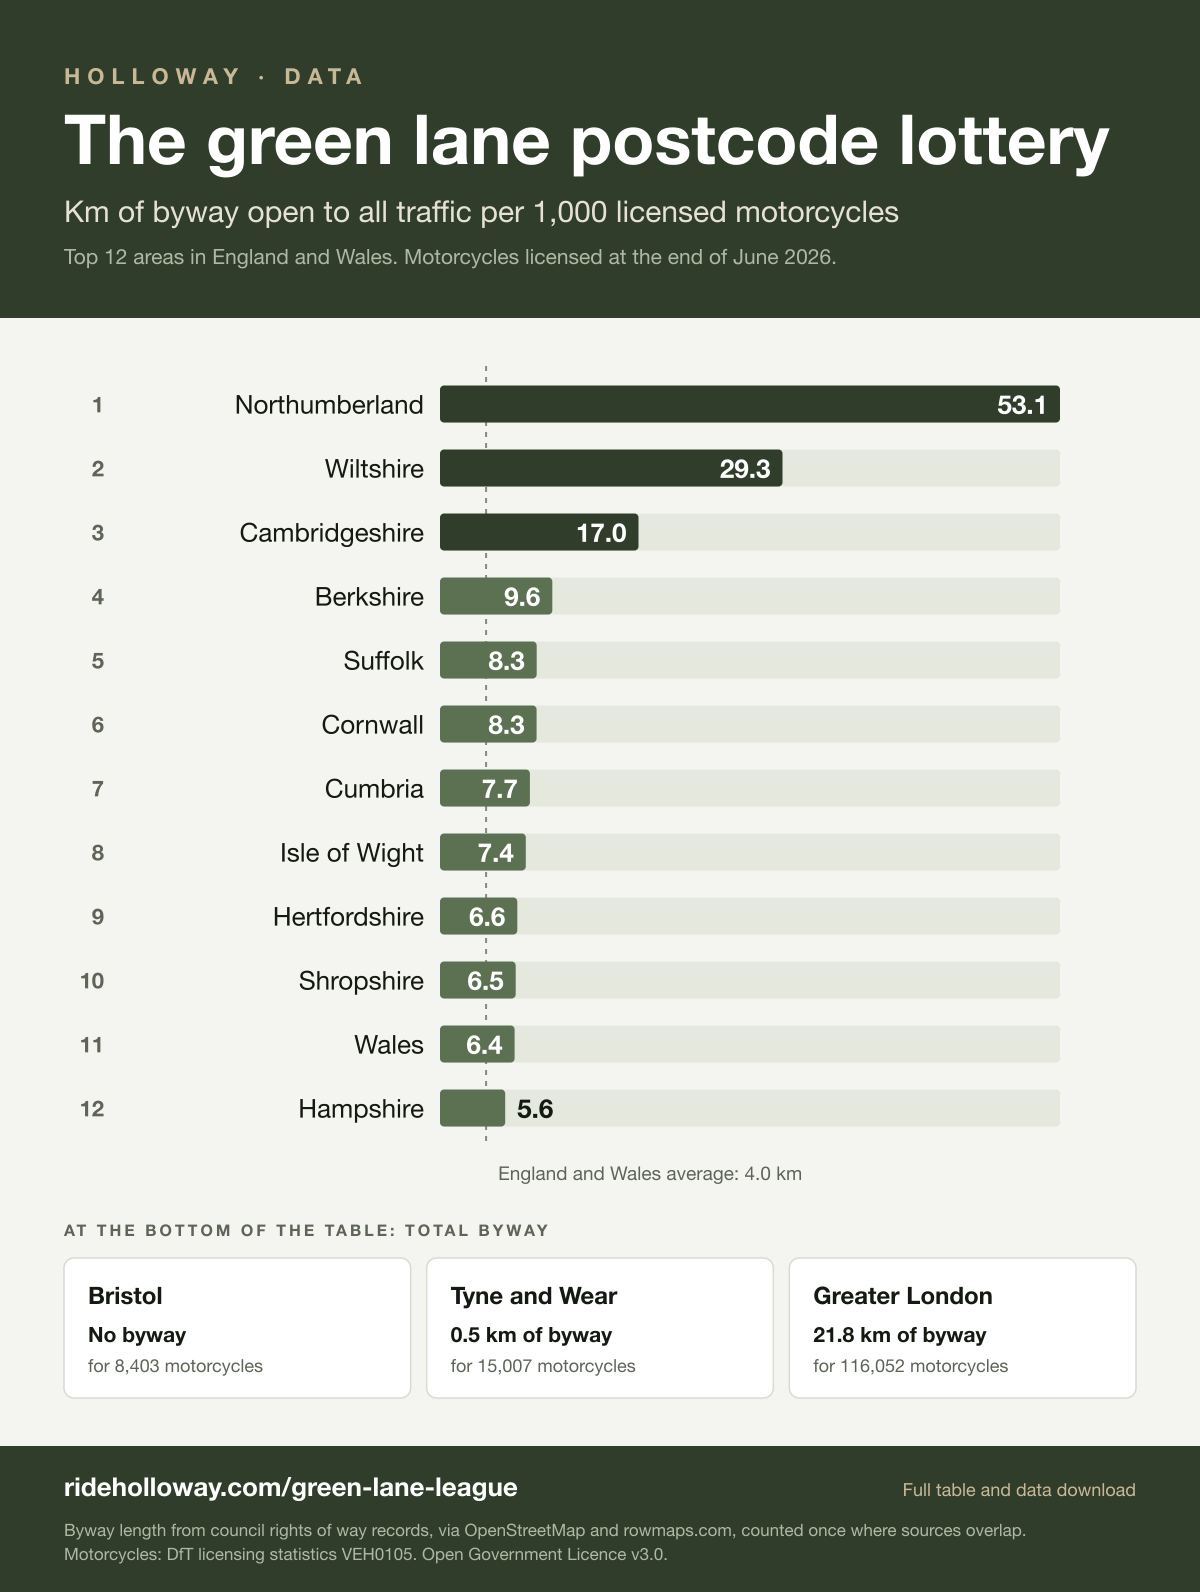
Kilometres of byway open to all traffic per 1,000 licensed motorcycles. Darker bars mean more byway per motorcycle. The dashed line marks the England and Wales average: most counties sit below it.
What stands out
- Northumberland comes out on top, with 436 km of byway open to all traffic for 8,204 licensed motorcycles, or 53.1 km per 1,000. Wiltshire is next at 29.3 and Cambridgeshire third at 17.0.
- Wiltshire has the most byway in total: 707 km, about 13% of everything we have recorded across England and Wales.
- The average is 4.0 km per 1,000 motorcycles, but the typical county is much lower. The median is 3.1, and 30 of 48 areas fall below the average. A few counties with a lot of byway pull it up.
- Towns and cities have almost none. Bristol, Tyne and Wear, Greater London are at the bottom: Greater London's 116,052 motorcycles share 21.8 km of byway between them.
- Big riding counties are not the richest in byway. Hampshire has 54,462 licensed motorcycles and 304 km of byway, 5.6 per 1,000. A motorcyclist in Northumberland has roughly 9 times as much byway to share.
Byways are not the whole picture
This league counts BOATs because their length is on the council Definitive Map. Plenty of other routes are open to motorcycles and are not in the ranking:
- Unclassified county roads (UCRs) and unsealed unclassified roads. These are public roads that happen to be unsurfaced. Highway authorities reported about 6,815 km of them in 2014/15, more than the BOAT total. They sit on the council's List of Streets, not the Definitive Map, so they are much harder to map. Holloway shows the ones it has found (about 3,115 km so far), with a caution that their status is worth checking locally.
- Restricted byways, bridleways and footpaths are not open to motor vehicles, so they are not counted anywhere here.
- Some BOATs are closed to motorcycles by Traffic Regulation Orders, all year or for part of it.
Our guide to every green lane classification explains the differences, and the Holloway map shows UCRs alongside BOATs.
Not every motorcycle is a green lane bike
The motorcycle count covers every licensed motorcycle, and most of those never leave the tarmac. The riders who use byways are mostly on adventure bikes, dual sports and enduros. The DfT table we use does not split motorcycles by type, so we can't rank counties on those bikes alone, and we haven't found a dataset that does by county.
The direction of travel is clear nationally, though. Adventure bikes were the best-selling new motorcycle type in the UK in 2025 (18,904 registered by the end of November, Visordown, from MCIA figures), and the segment is up about 26% so far in 2026 (Visordown). More adventure riders means more traffic on the same byways, which is one reason route planning and current closure information matter.
How far can you trust it?
We can't verify every lane in every county, so we tested this against the one national source there is: a 2014/15 survey of highway authorities by the Green Lane Association's mapping group (GLEAM).
- England: we have recorded 4,797 km of distinct BOAT, against 4,463 km in the survey (7% more).
- Wales: 489 km against 512 km (-5%).
- The gap is partly real. New BOATs have been added since 2014/15. Northumberland County Council, for example, has made a run of orders since 2021, which is likely why our Northumberland figure is more than double the survey's. We would welcome a corrected figure from any council that has one.
- Unclassified county roads are the weak spot. Authorities reported about 6,815 km of unsealed UCRs, and we have recorded about 3,115 km, roughly 46%. That is why this league counts BOATs only.
| County | Our BOAT km | 2014/15 survey km | Difference |
|---|---|---|---|
| Essex | 237 | 239 | -1% |
| Cambridgeshire | 394 | 402 | -2% |
| Kent | 235 | 222 | +6% |
| Hampshire | 304 | 285 | +7% |
| Leicestershire | 55 | 59 | -7% |
| Cornwall | 191 | 209 | -8% |
| Wiltshire | 707 | 819 | -14% |
| Suffolk | 222 | 190 | +17% |
| Cumbria | 127 | 106 | +19% |
| Norfolk | 63 | 51 | +23% |
| Devon | 94 | 72 | +30% |
| Lincolnshire | 38 | 26 | +47% |
| Dorset | 35 | 23 | +52% |
| North Yorkshire | 103 | 53 | +95% |
| Northumberland | 436 | 203 | +115% |
| Derbyshire | 68 | 10 | +577% |
Derbyshire's 2014/15 figure of 10 km looks like a gap in that survey rather than a real total. The survey lists the authorities with the most byway, so counties not in this table were not compared.
The full table
| # | County | BOAT km | Licensed motorcycles | Km per 1,000 |
|---|---|---|---|---|
| 1 | Northumberland | 435.6 | 8,204 | 53.1 |
| 2 | Wiltshire | 707.1 | 24,109 | 29.3 |
| 3 | Cambridgeshire | 394.1 | 23,179 | 17.0 |
| 4 | Berkshire | 188.3 | 19,581 | 9.6 |
| 5 | Suffolk | 222.3 | 26,852 | 8.3 |
| 6 | Cornwall | 191.4 | 23,157 | 8.3 |
| 7 | Cumbria | 126.6 | 16,438 | 7.7 |
| 8 | Isle of Wight | 49.7 | 6,766 | 7.4 |
| 9 | Hertfordshire | 144.2 | 21,786 | 6.6 |
| 10 | Shropshire | 95.4 | 14,716 | 6.5 |
| 11 | Wales (whole country) | 488.9 | 76,518 | 6.4 |
| 12 | Hampshire | 303.7 | 54,462 | 5.6 |
| 13 | Essex | 237.2 | 45,667 | 5.2 |
| 14 | Herefordshire | 35.0 | 6,795 | 5.2 |
| 15 | Nottinghamshire | 124.1 | 25,067 | 5.0 |
| 16 | Kent | 234.7 | 48,627 | 4.8 |
| 17 | Oxfordshire | 83.9 | 19,755 | 4.3 |
| 18 | Bedfordshire | 61.5 | 14,533 | 4.2 |
| 19 | Northamptonshire | 83.3 | 21,217 | 3.9 |
| 20 | Rutland | 4.7 | 1,250 | 3.8 |
| 21 | Surrey | 119.8 | 32,175 | 3.7 |
| 22 | East Sussex | 72.5 | 21,920 | 3.3 |
| 23 | North Yorkshire | 103.2 | 33,625 | 3.1 |
| 24 | Durham | 48.4 | 15,867 | 3.1 |
| 25 | Devon | 93.5 | 40,785 | 2.3 |
| 26 | Leicestershire | 54.9 | 24,789 | 2.2 |
| 27 | Derbyshire | 67.7 | 31,527 | 2.2 |
| 28 | Somerset | 64.2 | 33,542 | 1.9 |
| 29 | Norfolk | 62.8 | 33,856 | 1.9 |
| 30 | South Yorkshire | 39.3 | 26,018 | 1.5 |
| 31 | Dorset | 35.0 | 26,516 | 1.3 |
| 32 | Staffordshire | 37.7 | 29,891 | 1.3 |
| 33 | West Yorkshire | 39.0 | 37,510 | 1.0 |
| 34 | Lincolnshire | 38.1 | 37,405 | 1.0 |
| 35 | Buckinghamshire | 19.3 | 19,035 | 1.0 |
| 36 | Lancashire | 33.5 | 33,689 | 1.0 |
| 37 | East Yorkshire and Hull | 17.6 | 17,744 | 1.0 |
| 38 | Cheshire | 21.9 | 27,487 | 0.8 |
| 39 | Merseyside | 14.6 | 19,098 | 0.8 |
| 40 | West Sussex | 18.3 | 24,823 | 0.7 |
| 41 | Warwickshire | 9.4 | 16,489 | 0.6 |
| 42 | Gloucestershire | 12.6 | 29,010 | 0.4 |
| 43 | Worcestershire | 6.4 | 17,651 | 0.4 |
| 44 | Greater Manchester | 11.0 | 34,371 | 0.3 |
| 45 | West Midlands | 10.8 | 34,583 | 0.3 |
| 46 | Greater London | 21.8 | 116,052 | 0.2 |
| 47 | Tyne and Wear | 0.5 | 15,007 | 0.0 |
| 48 | Bristol | 0.0 | 8,403 | 0.0 |
Use this
Free to use with a credit and a link back to this page.
Copy this to put the image on your site:
How it was done
- Motorcycles. DfT table VEH0105, motorcycles, all fuels and keepers, end of June 2026, counted for each lower-tier council (districts, unitaries, metropolitan and London boroughs, Welsh unitaries) so nothing is counted twice. 99.6% of England and Wales's licensed motorcycles are placed in a county.
- Counties. Districts are grouped by the ONS district-to-county lookup. Unitary councils sit in the same area as their lanes do on our map, so Wales is one area and Greater London, Greater Manchester and the other metropolitan counties are each one area.
- Byway length. BOAT sections from council Definitive Map data, through OpenStreetMap and rowmaps.com, measured along the line. Where two records cover the same road within 12 metres, we count it once.
- The ratio. BOAT kilometres divided by motorcycles in thousands.
Contains Department for Transport licensing statistics and council rights of way data under the Open Government Licence v3.0, and OpenStreetMap data, © OpenStreetMap contributors.
Questions
How is the league calculated?
For each county we add up the distinct length of Byways Open to All Traffic (BOATs) we have recorded, then divide by the number of motorcycles licensed to keepers in that county, in thousands. The motorcycle figure is the Department for Transport's count at the end of June 2026. Where two sources record the same stretch of road, we count it once.
Why only BOATs, not all green lanes?
BOAT lengths come from council Definitive Maps, so they are the most complete figure we have. Unclassified county roads (UCRs) are not on those maps. Highway authorities reported about 6,815 km of unsealed UCRs in 2014/15 and we have recorded about 3,115 km, so a league that included them would mostly measure how well we have mapped each county.
Does a BOAT mean the lane is open today?
No. A BOAT is a designation. Some carry a Traffic Regulation Order that closes them to motor vehicles, permanently or for part of the year, and we have only read the council orders in some counties. Check each lane's current status on the map and look at the signs before you ride.
Where does the motorcycle count come from?
It is the Department for Transport's licensing table VEH0105, motorcycles, all fuel types and keepers, at the end of June 2026, under the Open Government Licence. Each bike is counted in the council area of its registered keeper, which is not always where it is ridden, and the DfT category covers scooters and mopeds as well as larger motorcycles.
Can you split it by type of motorcycle?
Not with this data. The DfT table counts all licensed motorcycles, including scooters and mopeds, and has no adventure, dual sport or enduro split. Most byway riders are on adventure bikes, dual sports and enduros, so the ratio understates pressure on the lanes from those riders in some counties and overstates it in others.
Can I use this data or the image?
Yes. Use the county figures or the infographic with a credit and a link to this page. The data download has each county's byway length, motorcycle count and ratio.
See the byways near you
The free Holloway map shows every lane in this league, with its type, status and any closure we know of.
Reference only. A BOAT is a designation, and legal status changes. Check signage and current Traffic Regulation Orders before riding.